
Understanding how much you owe in federal income tax starts with knowing the tax brackets and how they’ve shifted year over year. Below you’ll find the latest IRS tax tables, standard deduction amounts, historical comparisons, and tips to estimate your withholding more precisely.
This includes the latest data from the 2025 and 2026 tax year.
Check this out if you’re looking for the specific Capital Gains Tax Brackets and Rates.
What You’ll Learn
- 2025 and 2026 federal income tax brackets (by filing status)
- Adjusted standard deduction amounts
- Historical bracket comparison
- How to estimate your withholding and tax burden
- Key caveats and tax planning considerations
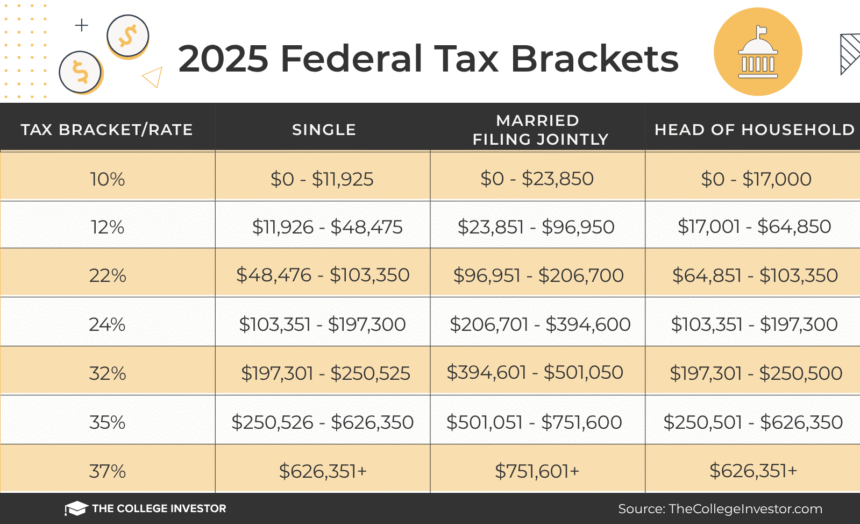
2025 Federal Tax Brackets
Here are the 2025 Federal tax brackets. Remember, these aren’t the amounts you file for your tax return, but rather the amount of tax you’re going to pay starting January 1, 2025 to December 31, 2025. These bracket ranges increased significantly for 2025 due to rising inflation.
The table below shows the tax bracket/rate for each income level:

2025 Standard Deduction
The standard deduction has also increased for 2025, due to inflation, which you can see in the table below. The OBBBA also increased the standard deduction or the 2025 tax year retroactively.
|
Standard Deduction Amount |
|
|---|---|
|
Filing Status |
2025 |
|
Single |
$15,750 |
|
Married Filing Jointly |
$31,500 |
|
Head of Household |
$23,625 |
2026 Federal Tax Brackets
Here are the 2025 Federal tax brackets. Remember, these aren’t the amounts you file for your tax return, but rather the amount of tax you’re going to pay starting January 1, 2026 to December 31, 2026. These bracket ranges increased slightly for 2026 due to rising inflation.
The table below shows the tax bracket/rate for each income level:

2026 Standard Deduction
The standard deduction has also increased for 2026, due to inflation and changes from the OBBBA.
|
Standard Deduction Amount |
|
|---|---|
|
Filing Status |
2026 |
|
Single |
$16,100 |
|
Married Filing Jointly |
$32,200 |
|
Head of Household |
$24,150 |
Prior Year Tax Brackets
Looking for some history? Here are the past years tax brackets and standard deduction levels.
For 2020 and 2021, the Federal tax brackets are very similar to what you saw in 2019. There are some slight changes, but nothing major like we saw from 2017 to 2018 with the Trump Tax Cuts and Jobs Act. However, 2022 is when things started expanding a bit.
The bottom line is that all the tax bracket upper limits went up a little bit.
The tables below shows the tax bracket/rate for each income level:
Here are the 2024 Federal tax brackets.

Here are the 2023 Federal tax brackets.

Here are the 2022 Federal tax brackets. Remember, these are the amounts you will pay when you file your taxes in January to April 2023 (for the year January 1, 2022 through December 31, 2022).
The table below shows the tax bracket/rate for each income level:
|
Tax Bracket/Rate |
Single |
Married Filing Jointly |
Head of Household |
|---|---|---|---|
|
10% |
$0 – $10,275 |
$0 – $20,550 |
$0 – $14,650 |
|
12% |
$10,276 – $41,775 |
$20,551 – $83,550 |
$14,651 – $55,900 |
|
22% |
$41,776 – $89,075 |
$83,551 – $178,150 |
$55,901 – $89,050 |
|
24% |
$89,076 – $170,050 |
$178,151 – $340,100 |
$89,051 – $170,050 |
|
32% |
$170,051 – $215,950 |
$340,101 – $431,900 |
$170,051 – $215,950 |
|
35% |
$215,951 – $539,900 |
$431,901 – $647,850 |
$215,951 – $539,900 |
|
37% |
$539,901+ |
$647,851+ |
$539,901+ |
Here are the 2021 Federal tax brackets.
The table below shows the tax bracket/rate for each income level:
|
Tax Bracket/Rate |
Single |
Married Filing Jointly |
Head of Household |
|---|---|---|---|
|
10% |
$0 – $9,950 |
$0 – $19,900 |
$0 – $14,200 |
|
12% |
$9,951 – $40,525 |
$19,901 – $81,050 |
$14,201 – $54,200 |
|
22% |
$40,526 – $86,375 |
$81,051 – $172,750 |
$54,201 – $86,350 |
|
24% |
$86,376 – $164,925 |
$172,751 – $329,850 |
$86,351 – $164,900 |
|
32% |
$164,926 – $209,425 |
$329,851 – $418,850 |
$164,901 – $209,400 |
|
35% |
$209,426 – $523,600 |
$418,851 – $628,300 |
$209,401 – $523,600 |
|
37% |
$523,601+ |
$628,301+ |
$523,601+ |
The standard deduction also slightly increased for 2021, which you can see in the table below.
|
Filing Status |
2021 |
|---|---|
|
Single |
$12,550 |
|
Married Filing Jointly |
$25,100 |
|
Head of Household |
$18,800 |
Here are the 2020 Federal tax brackets.
|
Tax Bracket/Rate |
Single |
Married Filing Jointly |
Head of Household |
|---|---|---|---|
|
10% |
$0 – $9,875 |
$0 – $19,750 |
$0 – $14,100 |
|
12% |
$9,876 – $40,125 |
$19,751 – $80,250 |
$14,101 – $53,700 |
|
22% |
$40,126 – $85,525 |
$80,251 – $171,050 |
$53,701 – $85,500 |
|
24% |
$85,526 – $163,300 |
$171,051 – $326,600 |
$85,501 – $163,300 |
|
32% |
$163,301 – $207,350 |
$326,601 – $414,700 |
$163,301 – $207,350 |
|
35% |
$207,351 – $518,400 |
$414,701 – $622,050 |
$207,351 – $518,400 |
|
37% |
$518,401+ |
$622,051+ |
$518,401+ |
Here are the 2019 Federal tax brackets.
|
Tax Bracket/Rate |
Single |
Married Filing Jointly |
Head of Household |
|---|---|---|---|
|
10% |
$0 – $9,700 |
$0 – $19,400 |
$0 – $13,850 |
|
12% |
$9,701 – $39,475 |
$19,401 – $78,950 |
$13,851 – $52,850 |
|
22% |
$39,476 – $84,200 |
$78,951 – $168,400 |
$52,851 – $84,200 |
|
24% |
$84,201 – $160,725 |
$168,401 – $321,450 |
$84,201 – $160,700 |
|
32% |
$160,726 – $204,100 |
$321,451 – $408,200 |
$160,701 – $204,100 |
|
35% |
$204,101 – $510,300 |
$408,201 – $612,350 |
$204,101 – $510,300 |
|
37% |
$510,301+ |
$612,351+ |
$510,301+ |
Here are the 2018 Federal tax brackets. This was a year of big change due to the Tax Cuts and Jobs Act.
|
Tax Bracket/Rate |
Single |
Married Filing Jointly |
Head of Household |
|---|---|---|---|
|
10% |
$0 – $9,525 |
$0 – $19,050 |
$0 – $13,600 |
|
12% |
$9,526 – $38,700 |
$19,051 – $77,400 |
$13,601 – $51,800 |
|
22% |
$38,701 – $82,500 |
$77,401 – $165,000 |
$51,801 – $82,500 |
|
24% |
$82,501 – $157,500 |
$165,001 – $315,000 |
$82,501 – $157,500 |
|
32% |
$157,501 – $200,000 |
$315,001 – $400,000 |
$157,501 – $200,000 |
|
35% |
$200,001 – $500,000 |
$400,001 – $600,000 |
$200,001 – $500,000 |
|
37% |
$500,000+ |
$600,001+ |
$500,000+ |
Calculating Your Withholding
If you’d like to calculate your withholding, you can use the IRS withholding calculator found at https://apps.irs.gov/app/withholdingcalculator/.
And note, remember on top of your Federal taxes, you also have to pay FICA Taxes. These are the payroll taxes that go to Social Security and Medicare. Plus, you may have to pay state taxes depending on your state.
The post Federal Income Tax Brackets And IRS Tax Tables appeared first on The College Investor.


