
As we delve into the world of Indian stock market performance, it’s essential to analyze the Nifty50 returns over the years. For those interested in investing in the Nifty50 index, understanding its historical performance is crucial. Here’s a list of Nifty50 returns during the last 14 years, providing valuable insights for investors and financial analysts alike.
- 2012: +27.7%
- 2013: +6.8%
- 2014: +31.4%
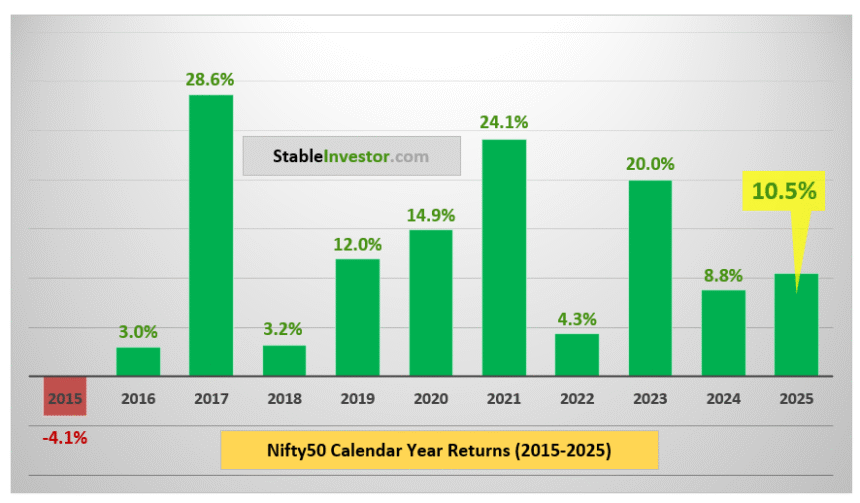
- 2015: – 4.1%
- 2016: +3.0%
- 2017: +28.6%
- 2018: +3.2%
- 2019: +12.0%
- 2020: +14.9%
- 2021: +24.1%
- 2022: +4.3%
- 2023: +20.0%
- 2024: +8.8%
- 2025: +10.5%
Upon reviewing the Nifty50 returns, it’s striking to note that in the last 14 years, we have had just one negative year! This occurred in 2015. Moreover, the Nifty50 has delivered 10 Consecutive Positive Years! This level of consistency is a testament to the index’s resilience and wealth creation potential.
The past decade has witnessed remarkable growth, with the Nifty50 index demonstrating an impressive ability to generate positive returns. Although past performance is not necessarily indicative of future results, this trend is undoubtedly worth acknowledging. For investors seeking to capitalize on the Indian stock market’s growth, understanding the Nifty50’s historical performance is essential.

This impressive track record is a positive indicator for investors looking to diversify their portfolios with Indian stocks. The Nifty50’s consistent performance is a testament to the growth potential of the Indian stock market.
Related reading – Nifty Annual Returns (25+ years data)
Related